
DEJ’s recent study, 24 Key Areas Shaping IT Performance Markets in 2022, revealed a 54% increase in the cost of one hour of IT service downtime since 2019. The study also showed a significant measurable business impact of each of the key focus areas identified by user organizations. Even though this study, which is based on insights from more than 3,300 organizations, includes monetary numbers for the cost of not acting in several domains, a deeper dive into the data behind this report reveals 13 areas, that if managed effectively, can enable organizations to save or generate millions of dollars.
This DEJ’s Research Note analyzes these areas and underlining challenges that are causing a negative business impact and missed growth opportunities.
| Disclaimer |
|
1 -The numbers below are calculated based on an average company size of 1,177 employees 2 – There is some overlap between these 13 areas |
1 – Optimizing cloud operations
$24.8 million – Average annual cost of not acting for managing cloud performance
This shows a 15% increase over the last 12 months based on the findings of DEJ’s 2021 study, The Total Business Impact of IT Performance. Some of the key challenges that contributed to this number are:
- Inability to find the right balance between cloud utilization of cloud resources and performance
- Time spent by engineers and developers on managing cloud operations instead of focusing on value creating tasks
- Inability to prevent issues with cloud performance for customer-facing services
2 – Kubernetes management
$6.773 million – Average annual cost of not acting around managing Kubernetes
The study shows Kubernetes management to be the fastest growing use case with a 76% increase over the last two years. Some of the key challenges that contributed to this level of business impact include:
- Lack of capabilities for automated rightsizing in a business context
- Time spent by high value staff on managing Kubernetes performance
- Business opportunities lost due to a lack of capabilities to troubleshoot performance
- Inability to optimize labor cost due to a lack of capabilities for a lifecycle approach for Kubernetes management
3 – Workflows and collaboration
$13.77 million – Average annual loss due to inefficiencies in collaboration processes and inability to optimize workflows
Some of the key challenges that contribute to this number include:
- Business loss due to issues with developers’ and engineers’ productivity
- Slow releases due to inefficiencies in software delivery workflows
- Inefficient workflows and collaboration processes for incident management
- Business loss due to a lack of orchestration capabilities
- Inability to ensure systems’ resilience
- Ineffective capabilities for knowledge management
4 – Lack of Observability
$10.254 million – average annual lost due to lack of Observability capabilities
As compared to the findings of DEJ’s 2021 study, this represents a 43% increase. Some of the key factors contributing to this type of business impact include:
- MTTR for cloud native applications is, on average, 55% longer as compared to monolithic environments. Additionally, the total cost of resolving performance issues for cloud native is 2.4 times higher as compared to more traditional environments
- $1.74 million – annual loss due to lack of capabilities for managing Observability data
- Revenue loss due to slow releases of new digital services caused by lack of Observability
5 – Managing Engineering Operations
$9.14 million – average annual loss due to ineffective management of engineering operations
This was one of the hardest areas to quantify the business impact, as many organizations lack visibility into resource utilization, inefficiencies in their processes and ability to benchmark their performance. Some of the key areas contributing to this number include:
- Engineers’ time spent on tasks that do not generate business value
- Revenue loss due to release delays
- Lack of visibility into engineers’ productivity and collaboration

6 – Employee management
$17.11 million – Average annual cost due to lack of capabilities for user management
The research shows a 19% increase in the business impact over the last 12 months. That increase is significantly impacted by the emerging need to manage talent that has important skills required for modernization and adopting a cloud native approach. DEJ’s 2022 state of the market study shows that organizations are losing (revenue loss and/or increased cost), on average, $13.74 million annually due to a lack of talent for modernization. Some of the other challenges that are contributing to the business impact from a lack of capabilities for employee management include:
- Lack of capabilities for visibility into employee adoption of new technology deployments (cost of unused licenses, disruption of business processes
- $2.282 million – average annual loss in employee turnover due to lack of visibility in employee experience
- Business loss due to lack of technology capabilities for enabling work from anywhere
- Inability to identify performance issues from the users’ perspective
7 – IT data management
$36.64 million – business loss due to a lack of capabilities for effective IT data management
The business impact of this area was spread across other domains of DEJ’s ARCO (Advantage, ROI, Cost of Not acting, Outcomes) methodology in the 2021 study on total business impact, so there is no relevant data to conduct year-over-year analysis. However, DEJ’s new research shows that IT data management and analytics capabilities are having the strongest impact on key business goals. Some of the areas that contributed to this level of business impact include:
- Time spent by high value employees on data management tasks that are not business critical or that can be eliminated
- Revenue loss due to inefficient software development processes caused by data not being delivered in a timely manner and in an actionable context
- Inefficient capabilities for enabling real-time applications
- Cost due to insufficient capabilities for data processing and storage
8 – Business context of management tools
$43.41 million – average annual loss due to a lack of capabilities for providing a business context for managing IT performance
Some of the key challenges contributing to this number include:
- $7.63 million – Average annual loss due to the inability to align software delivery initiatives to business outcomes
- Lack of capabilities for managing IT assets in a business context
- $745K – average annual loss due to not leveraging or poorly defining SLOs
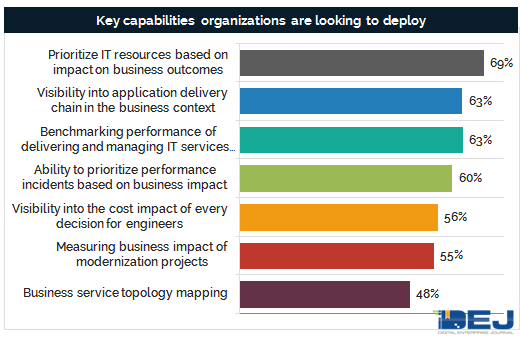
- Inability to prioritize IT resources based on the impact on business outcomes
9 – Network performance management
$17.31 million – average annual loss due to inefficient approaches for managing network performance
As organizations are increasingly looking to leverage technology as a source of competitive advantage, ensuring full control of network performance across a variety of environments has become more important than ever. Sixty-four percent of organizations in DEJ’s research reported that having full visibility into network performance has become more important over the last two years. Some of the key challenges contributing to a major business impact of network performance include:
- Inability to prevent network outages and reduce time to repair
- Business loss due to poor customer experiences caused by network performance
- Business loss due to the inability to leverage cloud services as a source of innovation caused by a lack of visibility into network performance
- Lack of capabilities for effectively supporting work from anywhere
- Inability to support major business initiatives for using technology as a competitive advantage
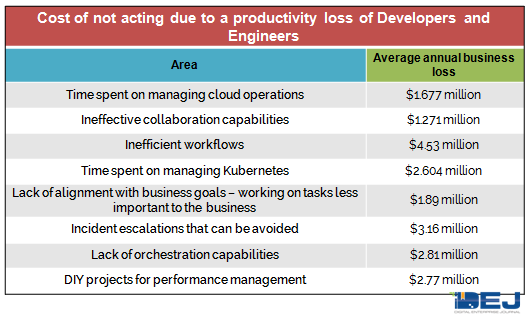
10 – Managing a software development lifecycle
$48.63 million – average annual loss due to inefficiencies of developing and releasing new digital services
There is a significant overlap of this number, with cost of not acting, in nearly all other areas listed, especially for:
- IT data management
- Collaboration and workflows
- Business context
The major contributor to this number is business loss due to developers and engineers not being able to focus on creating business value. The table below breaks down some of the key areas.
Other contributing factors include:
- $17.21 million – average annual cost of releasing digital services too soon
- Business loss due to lack of capabilities for monitoring new releases and changes from the users’ perspective
- $15.64 million – average annual business loss due to ineffective automation capabilities for different aspects of SDLC
11 – Enabling adoption of cloud native approach
$16.75 million – average annual loss due to the inability to effectively adopt a cloud native approach
DEJ’s recent study shows 3.6x ROI from effectively adopting a cloud native approach. However, organizations reported a wide range of challenges that they are facing when looking to modernize their environments and adopt cloud native. As a result of not being able to effectively address these challenges, organizations are experiencing a decline in their competitive position and a negative impact on other key business goals. Some of the key areas that contribute to millions being lost due to the inability to manage a cloud native journey include:
- Revenue loss due to being slow to the market (both from missed revenue opportunities and deterioration of their current revenue sources)
- Cost due to a lack of capabilities for managing the modernization process
- Cost of DIY for managing cloud native environments
The total cost of non acting around cloud native adoption is actually significantly higher than what the number listed above shows. The inability to achieve “soft” benefits, such as ability to adapt to market changes and ability to expand to new markets, from adopting a cloud native approach is harder to quantify, but is having a major impact on business goals.
12 – Addressing performance incidents
$50.41 million – average annual loss due to ineffectiveness in preventing performance issues and resolving them in a timely manner
This represents a 9% increase over the last 12 months. Two major challenges contribute close to 70% of this number:
- Inability to proactively prevent performance issues
- Time spent on identifying a root cause
Additionally, DEJ’s recent study shows that 66% of MTTR is spent on identifying change that is causing a problem. Some of the areas that significantly contribute to this cost of not acting include:
- Cost of incident escalations that can be avoided
- Business loss due to the inability to free up resources for performing high value tasks and focus on growth and innovation
- Business loss due to lack of capabilities for building a framework for intelligent incident response (learning from previous incidents, collaboration and workflows, etc.)
13 – Enabling AI/ML
This emerging area, if executed right, has the potential to have an enormous impact on the majority of key business goals. However, as of now, it is hard to accurately calculate the total cost of not acting around enabling AI/ML deployments. DEJ’s study shows a 46% increase in enabling MLOps as one of the key use cases over the last two years. Additionally, DEJ recently surveyed more than 600 organizations that are in different stages in adopting AI/ML models and MLOps practices.
$4.59 million – average annual business loss due to ineffective management of AI/ML models
Some of the key challenges that are contributing to this number include:
- Lack of visibility into performance of AI/ML models
- Inability to optimize resources for managing AI/ML
- Productivity loss by MLOps teams
- Inability to manage the entire modeling lifecycle
Though the numbers that show business loss due to a lack of management capabilities are alarming, even more startling is organizations’ lack of awareness of this level of business impact. The research shows that 84% of organizations are looking to deploy capabilities for correlating IT performance with business outcomes, while 68% do not have visibility into how their IT resources are being used.
Each of these 13 areas could be a gold mine for organizations to improve their competitive and overall business performance, but it all starts with visibility and building capabilities for connecting the dots between managing technology initiatives and key desired business outcomes.


