
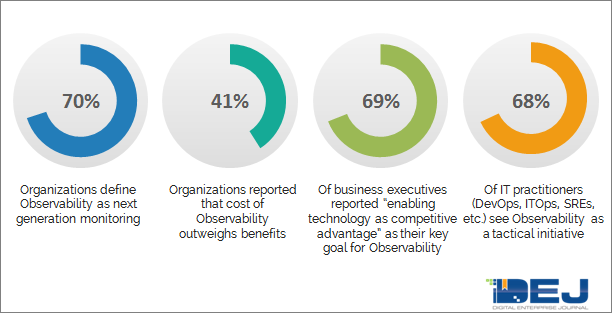
DEJ’s recent state of the market study, 24 Key Areas Shaping IT Performance Markets in 2022, revealed that for 69% of IT and business executives Observability is a “key enabler for using technology as a competitive advantage, while 68% of practitioners describe Observability as a tactical initiative. This is a significant issue as DEJ’s study, Strategies of Leading Organizations in Adopting Observability, shows that top performing organizations, those that are adopting Observability to deliver exceptional customer experiences and have well defined strategies for Observability data management and analytics, are able to generate 4.6 times more in revenue from new digital services, as compared to all others. For these organizations Observability is far from being a “tactical initiative”.
There are a few reasons that can explain this discrepancy in perspectives (DEJ’s recent panel podcast with three CEOs of Observability vendors dives deeper into this topic), such as a lack of business context of Observability solutions and a general absence of business and IT alignment. However, the key underlining issue is revealed in two of DEJ’s recent studies:
- 82% of organizations can not quantify the financial impact of IT Performance – The Total Business Impact of Managing IT Performance
- 75% of organizations are experiencing a negative impact on business performance due to technology management issues they are not aware of – 24 Key Areas Shaping IT Performance Markets in 2022
This comes down to “what you don’t know CAN hurt you”. So the real question presents itself, is the magnitude of the business impact of Observability strategies significant enough to create a sense of urgency to act? DEJ’s recent Research Note shows that an average annual lost due to lack of Observability capabilities is $10.254 million, which represents a 43% increase over the last 12 months. That number includes areas such as resources spent on troubleshooting performance issues, cost of managing Observability data and opportunity cost of revenue loss due to slow releases of digital services. However, the business impact of Observability deployment is more complex, goes beyond these three areas and depends on the types of Observability capabilities that organizations have in place.
DEJ’s upcoming report, “The Total Cost of Not Enabling a True Observability”, will analyze the monetary impact due to a lack of proper capabilities for addressing each of the key value areas of Observability. This Research Note highlights key domains that contribute to the total business impact of Observability deployments and that will be analyzed in this upcoming study.
Key areas
The best place to start our analysis is to look at key goals for deploying Observability, as reported in DEJ’s research.
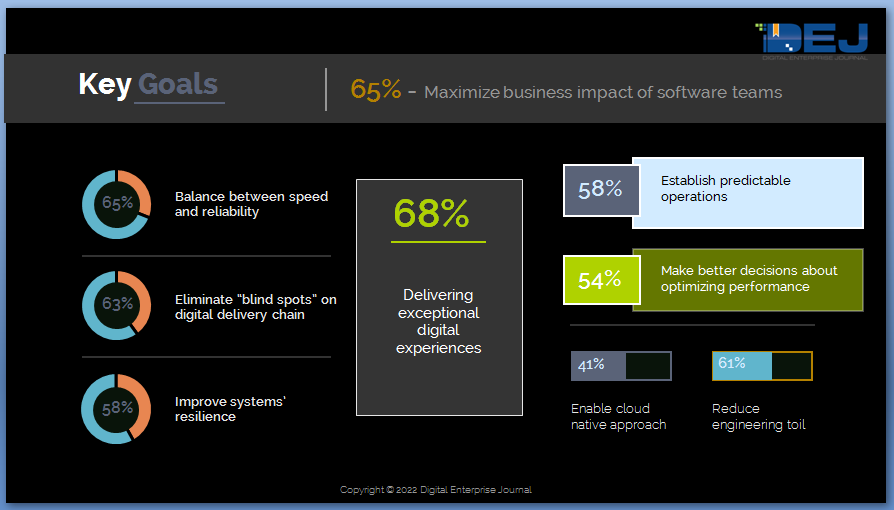
1 – Delivering exceptional user experiences
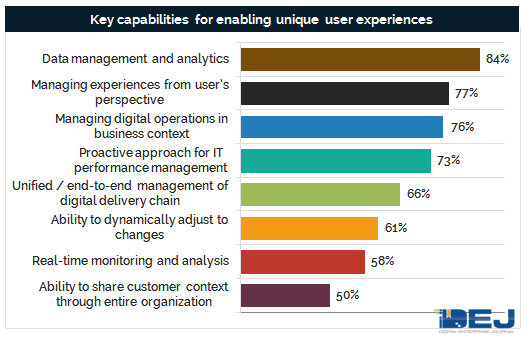
Design and build – The impact of Observability deployments on this goal spans across multiple areas and starts with providing actionable insights that can be used early in the software development life cycle, anywhere from planning to design and build. DEJ’s study shows that data management and analytics is the #1 enabler for creating unique customer experience (84% of organizations). DEJ’s research also shows that 64% of these organizations are using Observability insights in pre-deployment stages of creating new digital services. The impact of features of new releases on business results is enormous and the study will explore contribution of Observability deployments to the quality of customer experiences that are designed and built.
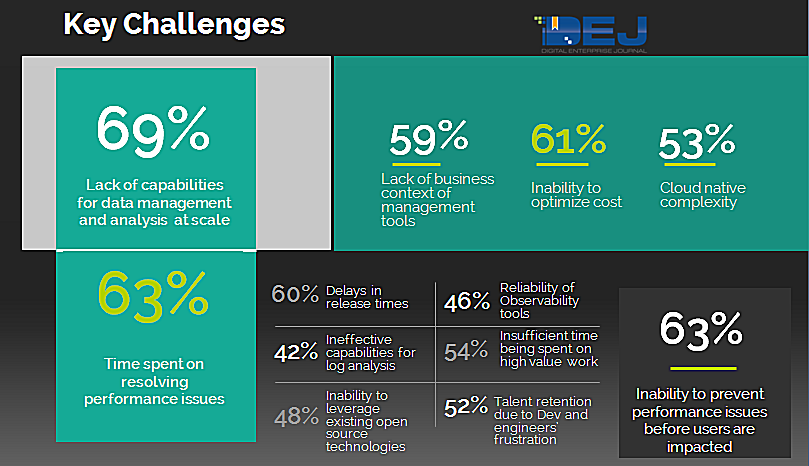
Preventing performance issues before users are impacted – DEJ’s 2021 study shows that organizations are, on average, losing $36.34 million due to the inability to proactively prevent performance issues. Sixty-three percent of organizations reported this area being one of their key challenges for Observability.
Managing experiences from the user’s perspective and providing business context around digital operations – These two areas have a significant overlap and for purposes of this analysis they are grouped together. The research shows that organizations are, on average, losing $16.7 million due to performance related issues with user experience (downtime, application slowdowns, etc.) while the cost of one hour of service downtime increased by 54% since 2019. Top performing organizations (TPOs – top 20% of survey respondents based on performance) in adopting Observability are 46% and 52% respectively more likely to focus on these two areas, as compared to all others. As a result, these organizations are experiencing a 91% higher success rate in avoiding issues with user experience.
2 – Eliminate “blind spots” on the application delivery chain
Identifying a root cause of performance issues and reducing MTTR – Sixty-three percent of organizations reported time spent on troubleshooting performance issues as a key challenge they are looking to address with Observability. DEJ’s research shows that this area has an enormous issue on business results, as organizations reported they are losing, on average, $50.41 million annually due to ineffectiveness in preventing performance issues and resolving them in a timely manner.
The research also shows that 1) the inability to proactively prevent performance issues; and 2) time spent on identifying a root cause contributes close to 70% of that number. Observability TPOs reported average MTTR per incident of 43 minutes, as compared to 2.9 hours for all others. Additionally, 41% of organizations are deploying Observability capabilities to enable a cloud native approach and the research shows that MTTR for cloud native applications is, on average, 55% longer as compared to monolithic environments. The study will dive deeper into all the key aspects of the cost of time and resources spent on troubleshooting and resolving performance issues.
3 – Maximize the business impact of engineering teams and reduce engineering toil
Engineers’ and developers’ productivity – DEJ’s Research Note shows millions being lost due to cost of not acting around engineers’ and developers’ productivity. Some of the areas that contribute to these numbers include:
- Time spent on managing cloud operations
- Time spent on managing Kubernetes
- Incident escalations that can be avoided and others
Each of these areas are addressable by effective deployments of Observability capabilities and DEJ’s research shows that Observability TPOs’, developers and engineers are nearly 3 times more likely to avoid spending time on unplanned work.
4 – Balance between speed and reliability
DEJ’s research shows that organizations are losing, on average, $36.6 million annually due to delays in application releases. Sixty percent of organizations are looking to address that issue by deploying Observability capabilities and the study will explore practices that can enable organizations to effectively address this issue.
5 – Enabling a cloud native adoption
DEJ’s research shows $16.75 million in average annual loss due to the inability to effectively adopt a cloud native approach. Addressing this issue is a key goal for deploying Observability capabilities for 41% of organizations. Additionally, organizations are reporting a skills gap as the#1 challenge (70% of organizations) for adopting a cloud native approach, while DEJ’s research shows that Observability TPOs are 2.7 times more likely to focus on recognizing developers’ frustration and avoid losing top talent. The study will provide a detailed business analysis of the role of Observability in enabling a cloud native approach and addressing issues with talent acquisition and retention.
6 – Managing Observability data
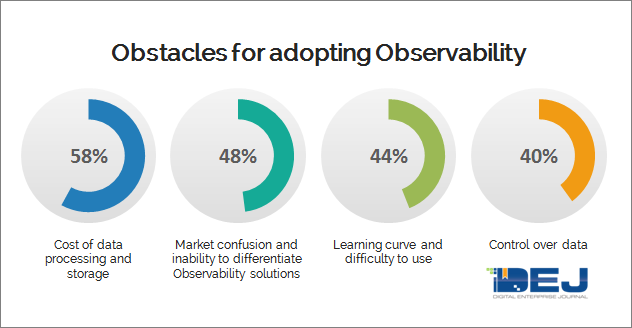
DEJ’s study shows a $5.18 million annual loss due to a lack of balance between cost/resources and performance of digital services. Also, the inability to optimize cost is reported by 61% of organizations as a key challenge for leveraging Observability solutions. Lastly, DEJ’s research shows cost of data processing and storage and control over data as key obstacles for deploying Observability. The study will highlight opportunities for cost savings by using the right mix of Observability capabilities.


